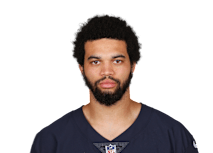
#140 overall · CHI · 221.9 projected half-PPR pts · -25.9 Draft Value
Caleb Williams — 2026 Fantasy Outlook
The case for drafting him
Caleb Williams has logged back-to-back seasons of 560-plus pass attempts, and his 2025 line showed real growth: 3,942 passing yards, 27 touchdown passes, and a fumbles-lost total that dropped from 5 to 1. His legs remain a consistent secondary contributor, with 77 rush attempts and 383 rush yards in 2025, and the three-year average sits at 79 rush attempts and 436 rush yards per season. That rushing floor gives him a path to fantasy points that a pure pocket passer does not have. The 2025 touchdown jump from 20 to 27 is the clearest single-season signal in his file, and the three-year average of 23.5 passing touchdowns reflects a player still trending upward rather than one coasting on a career peak.
What the model projects
The projection is 244.0 half-PPR fantasy points for 2026. That places Williams at QB13 and #120 overall, landing him in Tier 9. His draft value is -17.3, meaning the projection sits below replacement level at the quarterback position in a 12-team half-PPR format. The median simulated season (p50) comes in at 233.6 points, slightly below the point estimate of 244.0. Williams carries a bye in Week 10.
| Att | Comp | Pass yds | Pass TD | INT | Car | Rush yds | Rush TD | Fum | Half-PPR | |
|---|---|---|---|---|---|---|---|---|---|---|
| 2024 | 562 | 351 | 3541 | 20 | 6 | 81 | 489 | — | 9 | 254.5 |
| 2025 | 568 | 330 | 3942 | 27 | 7 | 77 | 383 | 3 | 7 | 322.2 |
| 3-yr avg | 565 | 340.5 | 3741.5 | 23.5 | 6.5 | 79 | 436 | 1.5 | 8 | 294.4 |
The range of outcomes
The outcome band is wide. At the low end, 10 percent of simulated seasons finish at or below 95.3 points: a genuinely difficult fantasy year. The 25th percentile lands at 175.0 points, still a tough return for a starting-lineup quarterback. The median sits at 233.6. From there the upside opens up: the 75th percentile reaches 299.9 points and the top 10 percent of simulated seasons finish at or above 354.1 points. That 354.1 figure represents a QB1 ceiling worth noting. The spread from p10 to p90 is nearly 259 points, which is a wide variance profile. The fumble history adds context: 9 fumbles in 2024 and 7 in 2025, with lost-fumble totals of 5 and 1 respectively. Turnover variance is a real driver of that downside tail.
(bottom 10%)
(median)
(top 10%)
our projection
How to draft him
Williams is ranked QB13 and #120 overall by draft value. The market, based on a median across two platforms, is drafting him at pick 81.0, which translates to round 7, pick 9 in a 12-team draft. His draft value is -17.3, placing him below replacement level at the position in this format. For drafters who run a late-quarterback strategy, that context matters: the projection and the negative draft value suggest he is best treated as a depth or streaming option rather than an anchor. If you want him, the market data says you are likely spending a pick in the seventh round to get him.
Practice it in a free mock draft →
Questions drafters ask
He completed 330 of 568 pass attempts for 3,942 yards and 27 touchdown passes against 7 interceptions. He added 383 rush yards and 3 rushing touchdowns on 77 attempts, and fumbled 7 times but lost only 1.
The projection is 244.0 half-PPR fantasy points. That ranks him QB13 and #120 overall, placing him in Tier 9 with a draft value of -17.3.
The bottom 10 percent of simulated seasons finish at or below 95.3 points. The median simulated season is 233.6 points. The top 10 percent of simulated seasons finish at or above 354.1 points, a range of nearly 259 points from floor to ceiling.
The market median across two platforms puts his average draft position at pick 81, which is round 7, pick 9 in a 12-team draft. That is the pick cost the market is currently pricing in.
Practice it in a free mock draft →
Beyond the rankings
This page ranks the players. Nobody has ranked the people in your league.
Half your room drafts off a sheet like this one. The managers who cash every year aren't holding a better sheet; they have tendencies, and after enough seasons the tendencies are a book. Your league's own draft history is where it's written.
RotoAlpha reads it. Paste your past drafts, from any platform, and every manager in your league gets a profile: who reaches, who chases runs, who pays up for their own team. Then it sits with you on draft night with a plan that adapts pick by pick, knowing who is likely to reach next.
Names invented. Most long-running leagues have a table like this.